Tracing
GraphQL::Tracing::Trace provides hooks to observe and modify events during runtime. Tracing hooks are methods, defined in modules and mixed in with Schema.trace_with.
module CustomTrace
  def parse(query_string:)
    # measure, log, etc
    super
  end

  # ...
end
To include a trace module when running queries, add it to the schema with trace_with:
# Run `MyCustomTrace` for all queries
class MySchema < GraphQL::Schema
  trace_with(MyCustomTrace)
end
For a full list of methods and their arguments, see GraphQL::Tracing::Trace.
By default, GraphQL-Ruby makes a new trace instance when it runs a query. You can pass an existing instance as context: { trace: ... }. Also, GraphQL.parse( ..., trace: ...) accepts a trace instance.
Detailed Traces
You can capture detailed traces of query execution with Tracing::DetailedTrace. They can be viewed in Google’s Perfetto Trace Viewer. They include a per-Fiber breakdown with links between fields and Dataloader sources.
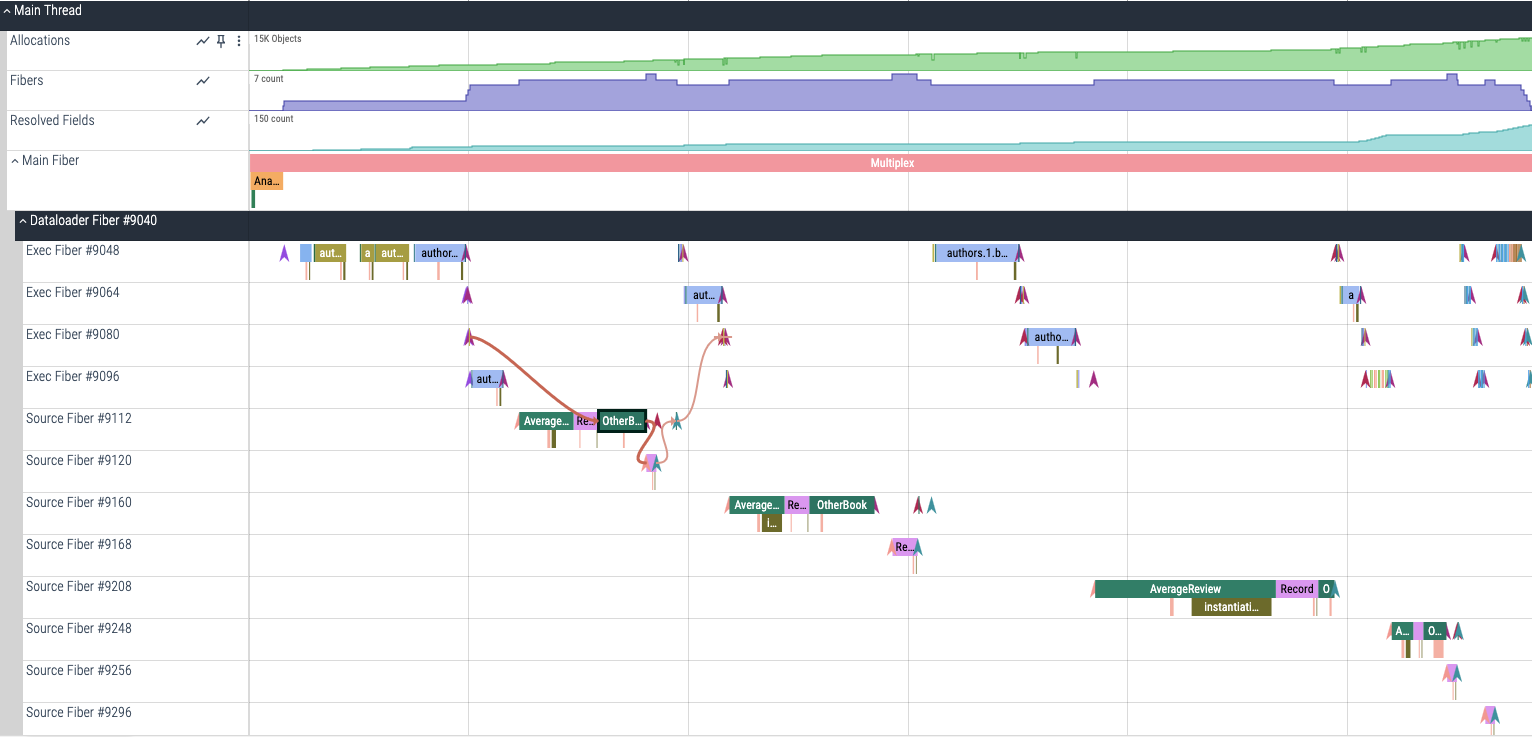 Dataloader Perfetto Trace
Learn how to set it up in the Tracing::DetailedTrace docs.
External Monitoring Platforms
There integrations for GraphQL-Ruby with several other monitoring systems:
-
ActiveSupport::Notifications: See Tracing::ActiveSupportNotificationsTrace. -
AppOptics instrumentation is automatic in
appoptics_apmv4.11.0+. -
Datadog: See Tracing::DataDogTrace.
-
Scout APM: See Tracing::ScoutTrace.
-
Sentry: See Tracing::SentryTrace.
-
Skylight: either enable the GraphQL probe or use Tracing::ActiveSupportNotificationsTrace.
-
Statsd: See Tracing::StatsdTrace.